Application Monitoring
Do you actively monitor your applications?
Chances are that if your development team doesn't, your operations group does. There are a variety of metrics that they are watching at a high level like CPU and memory usage performance counters and whether or not your applications and services are up or down. These help them to know whether or not there is trouble on the rise or if it has already arrived.
The alternative is to not monitor your applications and wait until something fails. The risk of the "wait-and-see" approach is much greater, however, because the stress and cost of fixing the issue may be high.
Monitoring in Other Domains
Application monitoring reminds me of the data-centric direction that healthcare is moving. In a podcast I heard recently with Peter Diamandis, he mentions that we will be seeing more and more bio-metric sensors that we can wear, ingest, or inject below our skin that constantly monitor what we eat and breath and our health levels such as glucose. Instead of waiting to deal with a problem that has become visible either to the naked eye or our sense of pain with critical care, we will be able to leverage preventative maintenance when conditions indicate that a problem is on the horizon.
This is very similar to the airline industry in which airplane engines are already equipped with hundreds of sensors that can indicate when anything is out of the norm, and when identified, immediately move the airplane into service mode for maintenance.
Most of our applications are not dealing with life and death consequences when they fail, but it is still vitally important to monitor our applications to sense when something is out of the norm so that we can prevent future issues.
Transaction Monitoring
Most monitoring is at a very high level and does not expose the kind of application details that a development group might be more interested at the transaction level. For each type of transaction, you may be interested in knowing the following metrics for a given time period:
of Successful Transactions
of Failed Transactions
Average Execution Time for a Transaction
This kind of information would help development teams to know if their applications or any third party dependencies inside or outside of the organization are performing at expected or contractually agreed upon levels (service level agreements) for different types of transactions within the application.
Unfortunately, this kind of data is not automatically emitted from your applications as performance counters. It requires some custom code.
James.Diagnostics
I have released a new .NET library (James.Diagnostics) on NuGet.org that can make the set up and use of these counters relatively simple compared to the out-of-the-box method that Microsoft has provided. (If any of you have tried creating custom performance counters, you will know what I mean.)
James.Diagnostics is a convention-based library built on top of Magnum to help you to add custom performance counters to your existing applications. It is based on the assumption that in most cases you will want to instrument your application logic for:
Successes
Failures
Average Execution Times
If you need other types of custom counters, libraries such as Magnum, written by Chris Patterson and Dru Sellers, can help you. If you are interested in reviewing the source code or contributing, you can find it here.
Installing the Library
From the package manager console in Visual Studio, you can enter the following:
> install-package James.Diagnostics
Creating Performance Counters
Let's say you have a service that allows clients to get and update customer information.
public IEnumerable GetCustomers()
{
    return _repository.GetAll();
}

public void UpdateCustomer(Customer customer)
{
    _repository.Update(customer);
}
Creating custom performance counters for these two methods is as simple as inheriting CounterCategory and implementing the IMonitorableCounterCategory for each as shown below.
public class CustomerService_GetCustomersCounters
    : CounterCategory, IMonitorableCounterCategory
{
  public Counter Succeeded { get; set; }
  public Counter Failed { get; set; }
  public Counter ExecutionTime { get; set; }
}

public class CustomerService_UpdateCustomerCounters
    : CounterCategory, IMonitorableCounterCategory
{
  public Counter Succeeded { get; set; }
  public Counter Failed { get; set; }
  public Counter ExecutionTime { get; set; }
}
Once you have these in place, you can begin to use those to Monitor() your methods.
public IEnumerable GetCustomers()
{
    return Monitoring<CustomerService_GetCustomerCounters>.Monitor(() => _repository.GetAll());
}

public void UpdateCustomer(Customer customer)
{
    Monitoring<CustomerService_UpdateCustomerCounters>.Monitor(() => _repository.Update(customer));
}
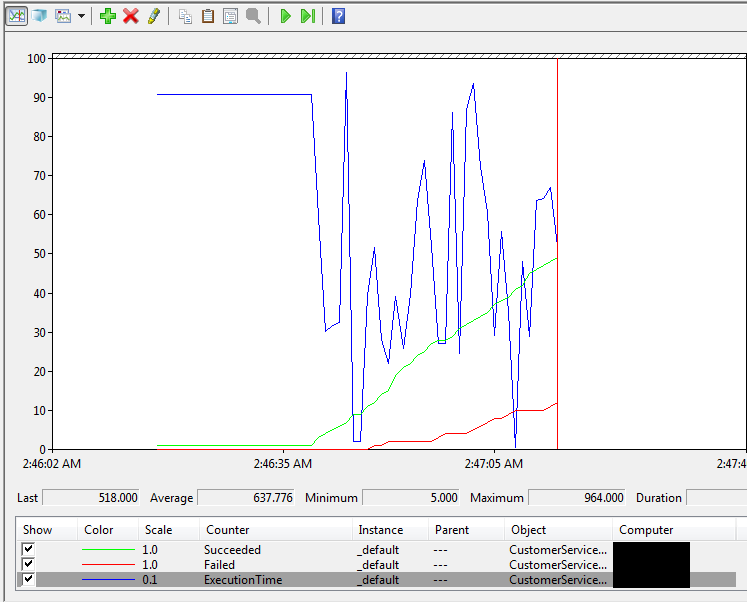
Below is a sample screenshot of Performance Monitor showing one of these performance counter categories in action. In the graph there are three colored lines representing the three counters.
Blue Line - represents the execution times in milliseconds.
Green Line - represents the number of successes.
Red Line - represents the number of failures.
If these metrics are brought into tools such as SCOM, they can be further manipulated to derive computed metrics such as the percentage of successes or average execution times aggregated by time periods.
Synchronous Monitoring Options
There are multiple options for monitoring the execution of your synchronous code with custom performance counters.
void Monitor(Action action)
Takes an action and increments the success/failure counters depending on whether or not the action succeeds (ie. - does not throw). If an exception does occur, it will bubble this up.
T Monitor<T>(Func<T> function)
Takes a function and increments the success/failure counters depending on whether or not the action succeeds (ie. -does not throw). If an exception does occur, it will bubble this up. If it succeeds, it will also return the result of the function call.
void Monitor(Func<bool> function)
Takes a function that returns a true/false and increments the success/failure counters depending on whether or not the function returns a true or false. It will not return the boolean value to the client, however. So, only use this method if you are instrumenting something that gracefully handles exceptions by not bubbling them up.
Asynchronous Monitoring Options
Sometimes, the distance between beginning and ending your monitoring is not just in time but also by process or machine. This often occurs in distributed systems (especially messaging) where the process that you would like to instrument occurs on one machine or process and ends in another. James.Diagnostics has you covered in these scenarios.
Process 1: Sending Message
public void SendMessage(Customer customer)
{
    var message = new CustomerUpdate
        {
            Customer = Customer,
            Success = true,
            Start = DateTime.Now.ToUniversalTime()
        };

    _bus.Publish(message);
}
Process 2: Consuming Message
public void Consume(CustomerUpdate message)
{
    var elapsed = DateTime.Now.ToUniversalTime().Subtract(message.Start);
    message.Success
        ? Monitoring<CustomerService_CustomerUpdatedCounters>.Success(elapsed)
        : Monitoring<CustomerService_CustomerUpdatedCounters>.Failure();
}
You will notice that in the case of the Failure() method, there is no TimeSpan to be provided. This is because a failure will either happen immediately or due to timeout, may be very lengthy. In either situation, you will not want to skew your average execution time metrics.
Conclusion
Whatever approach you choose to take, emitting transaction-level metrics are an important piece you should add to any of your applications to provide more insight. If you do try out James.Diagnostics, let me know. And any feedback you provide will be appreciated.
Hope it helps!